Google Chrome’s development team recently added a heads-up display (HUD) to help developers and users track the performance metrics of different websites. The HUD tracks metrics that are part of Google’s Core Web Vitals platform such as Largest Contentful Paint (LCP), First Input Delay (FID), and Cumulative Layout Shift (CLS). Today, we will be taking a closer look at how you can enable this HUD on Chrome, what these metrics actually mean, and how it affects your website.
Enable Chrome’s Benchmark HUD
There are two methods to view Chrome’s benchmarks as a heads-up display. You can either enable the HUD with the help of the new feature flag within Chrome or use the official Chrome extension.
Enable Chrome’s Benchmark HUD Using Feature Flag
Google’s experimental benchmark HUD currently exists behind a feature flag in the latest Chrome Canary. In this article, I’ve used Chrome Canary 89.0.4349.3 for demonstration. You can follow these steps to enable the HUD on Chrome across Mac, Windows, Linux, Chrome OS, and Android.
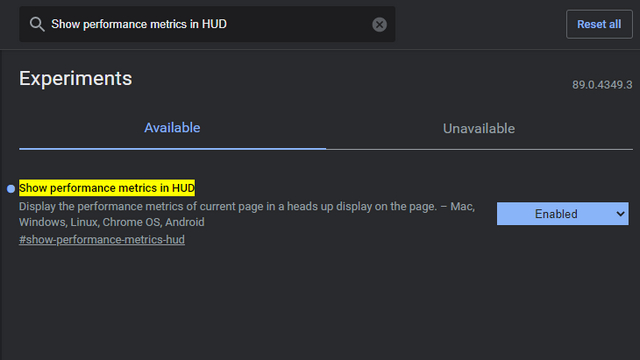
1. Open Google Chrome Canary and visit chrome://flags. In the search box available on this page, search for ‘Show performance metrics in HUD’, and choose ‘Enabled’. Alternatively, you can paste the URL given below to your browser’s address bar.
chrome://flags/#show-performance-metrics-hud
2. After enabling the flag, restart the browser. You will now notice Chrome’s new benchmark HUD in the top right corner of the browser. Unfortunately, the HUD doesn’t support drag and drop for repositioning at this moment, so you are left with viewing it in the same place.

Enable Chrome’s Benchmark HUD Using Chrome Extension
If you’re not willing to live on the bleeding-edge with Chrome Canary, you can install the Chrome extension released by Google to get a similar HUD instead. Here’s how you do it:
1. Open Google Chrome and visit Chrome Web Store. In the search box, type ‘Web Vitals’ and install the one offered by addyosmani. Alternatively, you can use this link to directly open the extension’s page.

2. After installing the extension, you’ll see the same metrics offered with the feature flag. You can use either of these based on your convenience and preference. Since there is no option to quickly disable the feature flag version now, I’d recommend using the Chrome extension.

Features of Chrome’s Benchmark HUD
Chrome’s benchmark HUD currently offers the following features:
- Largest Contentful Paint (LCP)
- First Input Delay (FID)
- Cumulative Layout Shift (CLS)
- Average Dropped Frame (ADF)
Largest Contentful Paint (LCP)
Largest Contentful Paint (LCP) measures the time taken to render the largest image or text block in the viewable portion of the web page. Google recommends websites to have LCP within the first 2.5 seconds for an ideal user experience. LCP somewhere around 2.5 seconds to 4 seconds is considered average and duration beyond that counts as poor and may result in poor UX.

To keep LCP within 2.5 seconds, the company urges developers to measure the 75th percentile of page loads across mobile and desktop versions. To put it in simpler terms, all you have to do is make sure that at least 75 percent of page views meet the required good threshold, which in this case is 2.5 seconds.
First Input Delay (FID)
While LCP was all about loading speed, First Input Delay (FID) represents the responsiveness of a web page. It measures the time from when a user interacts with a page to the time the page manages to start processing to respond to the action. It is worth noting that FID doesn’t include the overall processing time.

In ideal scenarios, a website’s FID value should be less than 100 milliseconds. The range between 100 milliseconds to 300 milliseconds needs improvement. If the time exceeds 300 milliseconds, the webpage is considered to have a poor FID. You can follow the same 75th percentile page load approach discussed above to maintain a good FID score.
Cumulative Layout Shift (CLS)
Cumulative Layout Shift (CLS) keeps track of all those annoying times when the content of a website suddenly shifts up or down without any warning. In other words, CLS measures the visual stability of a website.

According to Google, layout shifts primarily happen when resources of the page are loaded asynchronously or when DOM elements are dynamically added to a web page. A good CLS score is less than 0.1. Scores above 0.25 are treated as poor. You can learn more about how CLS scores are calculated right here.
Average Dropped Frame (ADF)
Average Dropped Frame (ADF), as the name suggests, shows the percent of frames dropped when the user interacts with the web page. Lower ADF percents will result in better performance, while high dropped frames may cause lags and other performance issues. As of this writing, ADF is available only on the feature flag version of the HUD.
Use Chrome’s Benchmark HUD to Track Website Performance
In a blog post last month, Google announced its plans to consider Core Web Vitals – LCP, FID, and CLS as ranking signals from May 2021. If you’re a website owner or a developer, now would be a good time to optimize the user experience of your website using Chrome’s Benchmark HUD to avoid getting negatively impacted by the upcoming update. For more such tips, do not forget to check out our Google Chrome tips and tricks article.