You can use ChatGPT to write essays and for a myriad of other tasks, but did you know, you can create graphs, charts, and diagrams as well in ChatGPT? Yes, with the help of plugins, you can visualize data with ChatGPT in different styles and forms. Not to mention, free ChatGPT users can also create complex diagrams to understand complex concepts. On that note, let’s learn how to draw graphs and diagrams using ChatGPT.
Draw Graphs, Charts, and Diagrams in ChatGPT Using Code Interpreter
Code Interpreter has finally arrived on ChatGPT and now you can achieve all kinds of tasks including generating graphs, charts, diagrams, and much more. You can even upload files to ChatGPT and ask ChatGPT to study the data and create different kinds of charts. It is one of the most powerful tools available on ChatGPT, and you must learn to use it to your full advantage. That said, keep in mind, the feature is only available to paid ChatGPT Plus users (costs $20 per month). On that note, let’s begin.
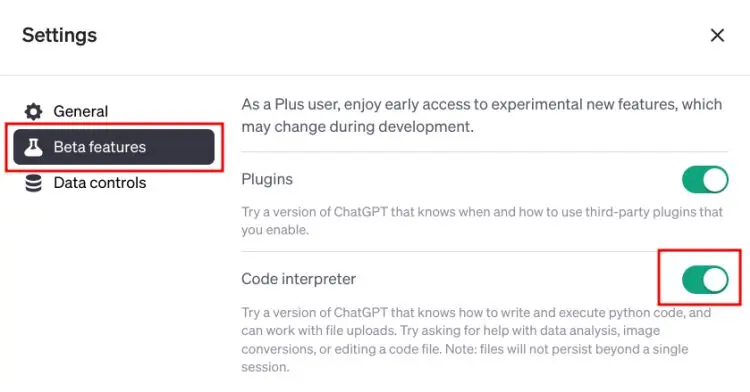
1. First, follow our detailed tutorial and enable Code Interpreter in ChatGPT.
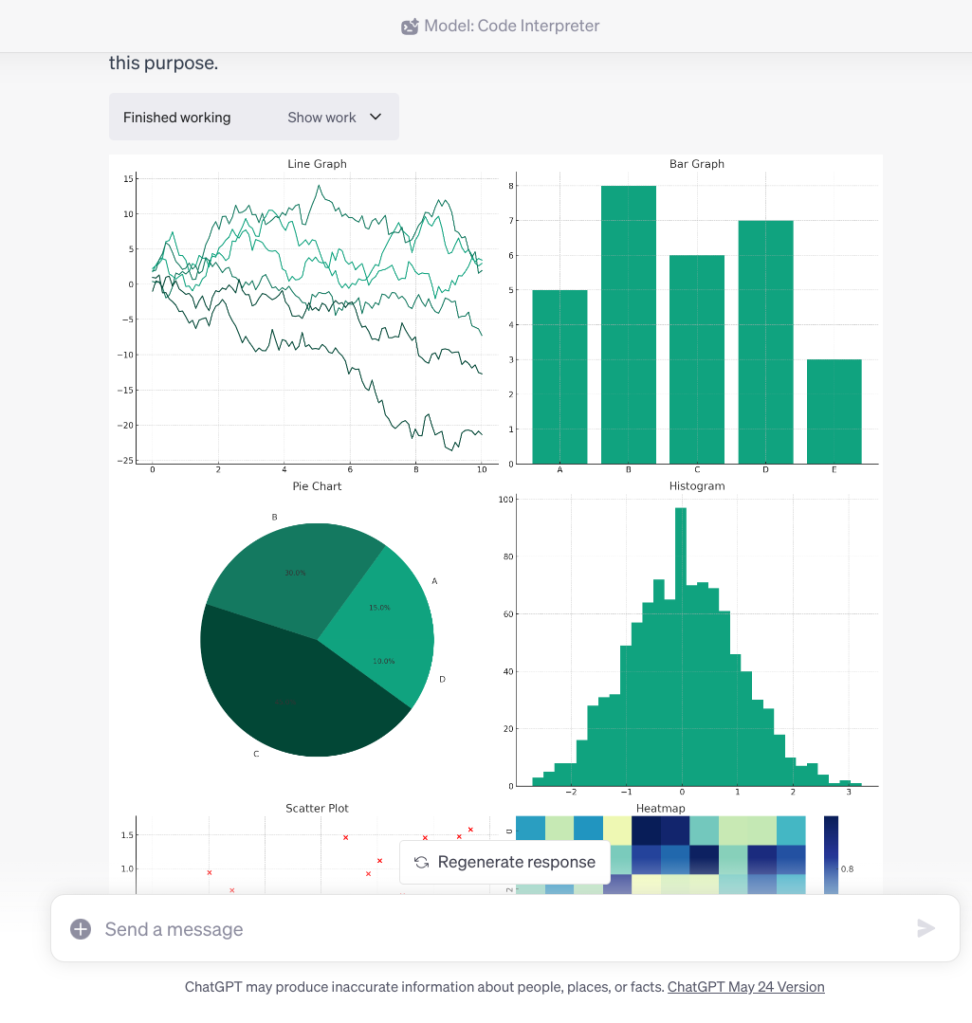
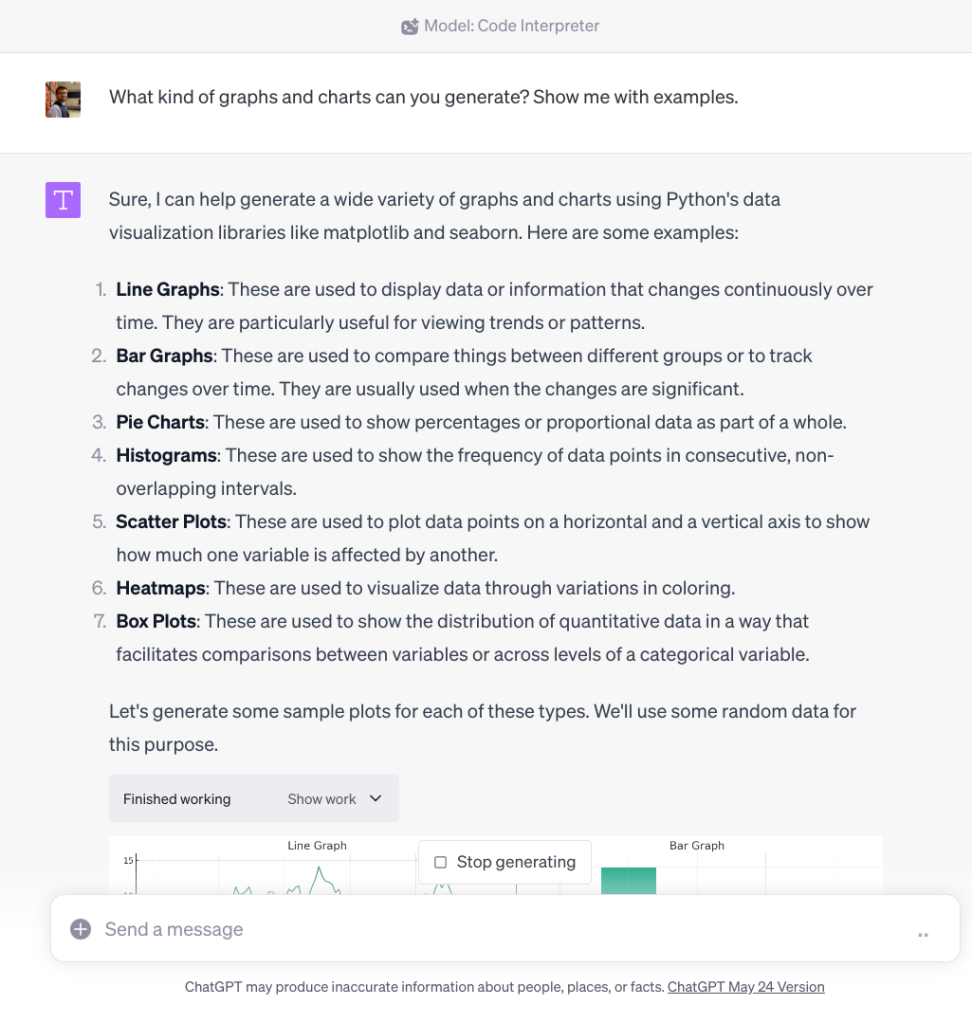
2. Once enabled, you can start by asking about its data visualization abilities. As you can see, it can create line graphs, bar graphs, pie charts, scatter plots, histograms, heat maps, and more.
What kinds of graphs and charts can you generate? Show me with examples.
3. Now, simply upload your data and ask it to visualize the data. For example, I have uploaded world population data and created a line graph. You can upload CSV, XLS, XLSX, and other file formats as well.


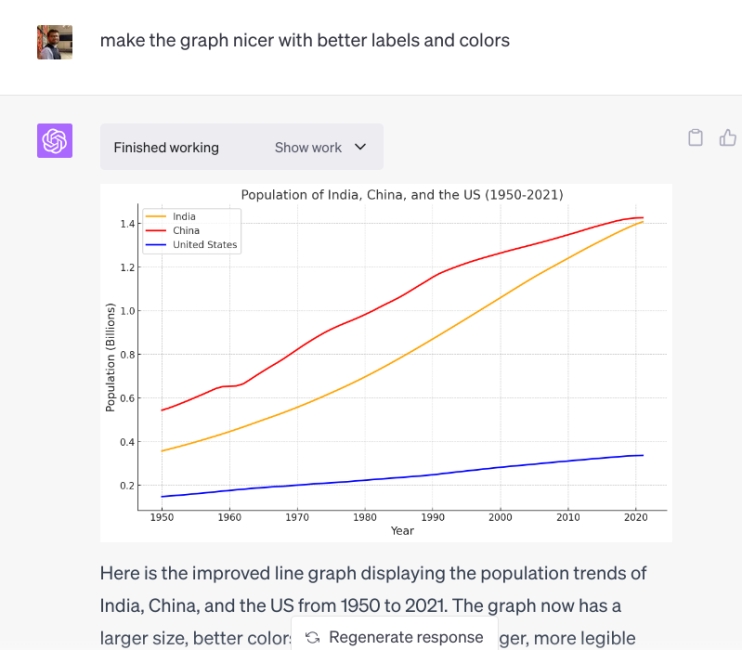
4. You can also ask Code Interpreter to make the graph look pretty like this.
make the graph nicer with better labels and colors
5. You can also ask Code Interpreter to find key insights from the data and visualize it. This is interesting, right?


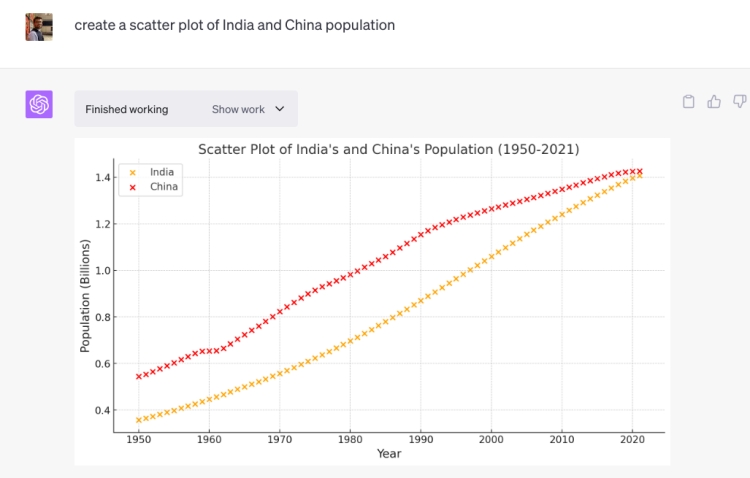
6. You can also create a scatter plot to compare two variables. Basically, you can generate any kind of charts, graphs, and diagrams with ChatGPT’s Code Interpreter tool.
Draw Graphs, Charts, and Diagrams Using ChatGPT Plugins
Users who have subscribed to ChatGPT Plus can enable ChatGPT Plugins and install some awesome plugins to visualize data. You can use either Show Me Diagrams or the daigr.am plugin to generate graphs, charts, diagrams, and flowcharts. Learn how you can use ChatGPT plugins to create graphs and diagrams in ChatGPT.
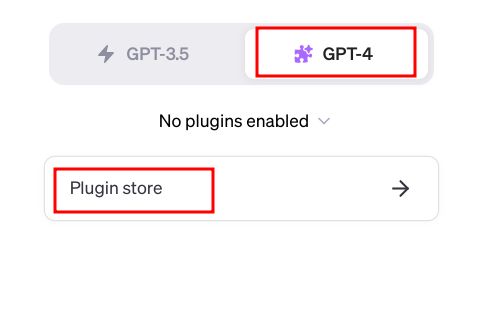
1. Launch ChatGPT (visit) and move to the GPT-4 model.
2. Select the “Plugins” option.
3. Open the Plugin store.
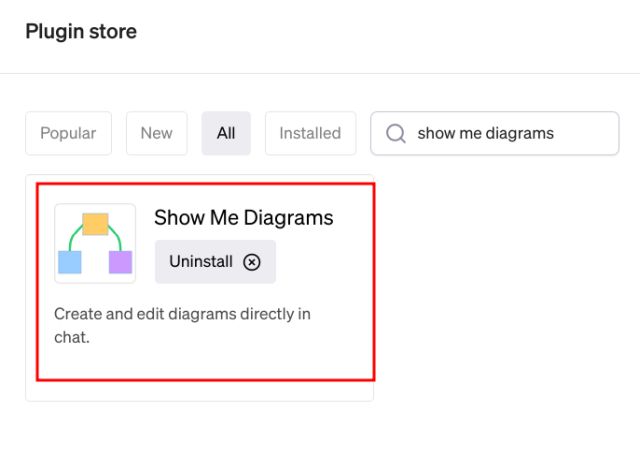
4. Install the Show Me Diagrams plugin from the Plugin Store. By the way, you can install the daigr.am plugin as well.
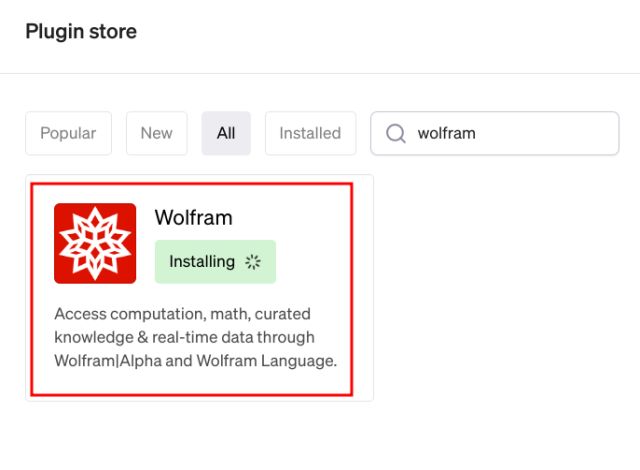
5. I also recommend installing the Wolfram ChatGPT plugin to access real-time data from the internet on any subject.
6. Enable both plugins. Now, to begin with, I asked ChatGPT to create a line chart showing the global earth temperature from 2010 to 2018. It immediately pulled data from Wolfram and created a chart using the two plugins. You can also ask ChatGPT to create a pie chart, bar chart, line chart, etc.

7. In another example, I used data from a research paper and asked ChatGPT to visualize the data. It automatically came up with the right bar chart and created the chart.


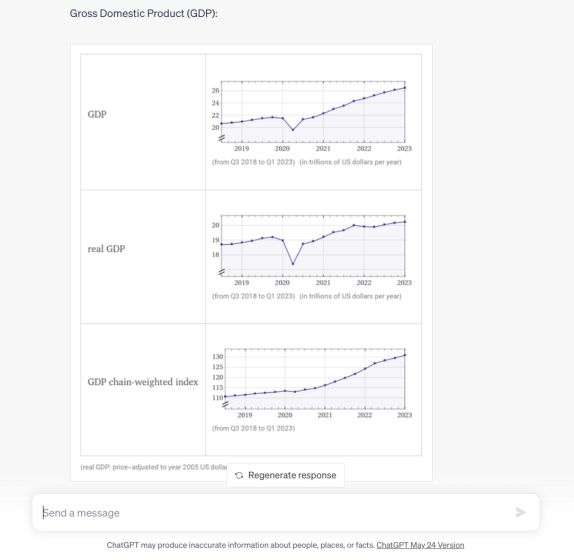
8. After that, I asked the chatbot to make a graph of the US GDP in the last 5 years and it came up with multiple graphs.
9. Finally, it helped me create a diagram of different types of AI technologies as well. You can use diagrams to break down and understand complex concepts.


How to Create Diagrams Using ChatGPT & Draw.io for Free
You can also draw graphs and diagrams in ChatGPT for free. Using the Mermaid language syntax, you can generate the code and paste it into any diagramming application for visual output. Here is how it works.
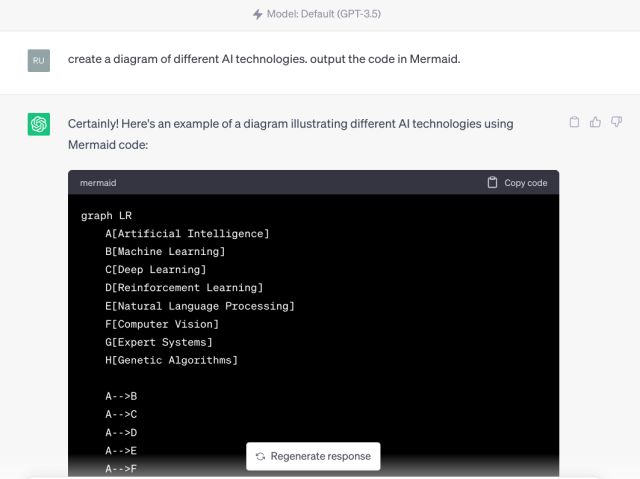
1. Open the free version of ChatGPT and ask it to create a diagram on your chosen topic. Finally, ask it to output the code in Mermaid. Now, copy the code.
create a diagram of different AI technologies. output the code in Mermaid.
2. Next, open a diagramming application of your choice. I am using drawio.com (visit) as it’s free and easy to use.
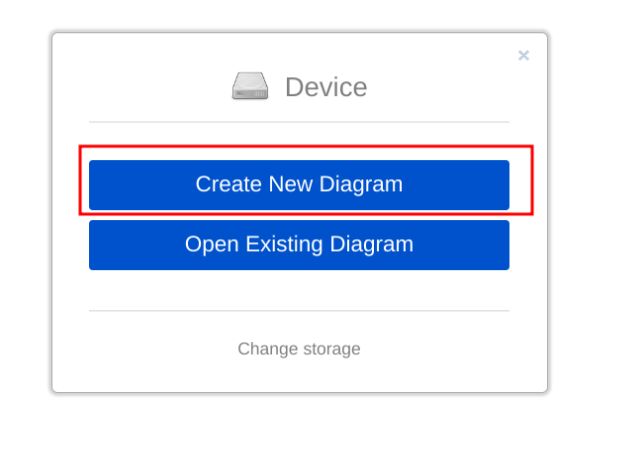
3. Create a blank diagram. After that, in the top-row menu, click on Arrange -> Insert -> Advanced -> Mermaid.
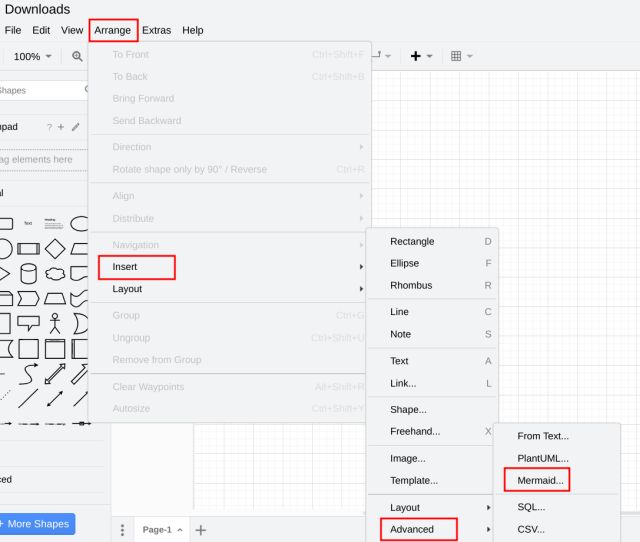
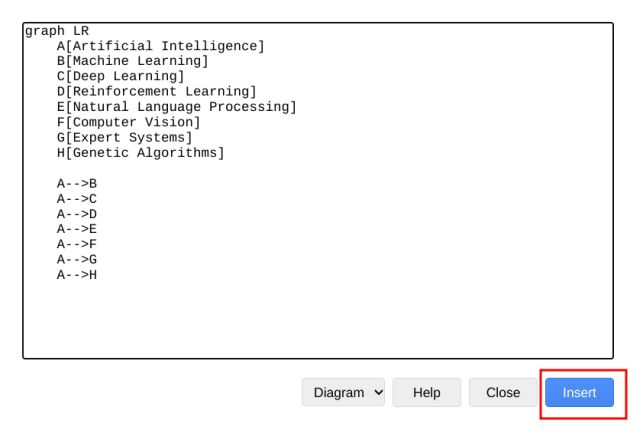
4. Here, remove the existing code and paste the Mermaid code you copied from ChatGPT. Now, click on “Insert” here.
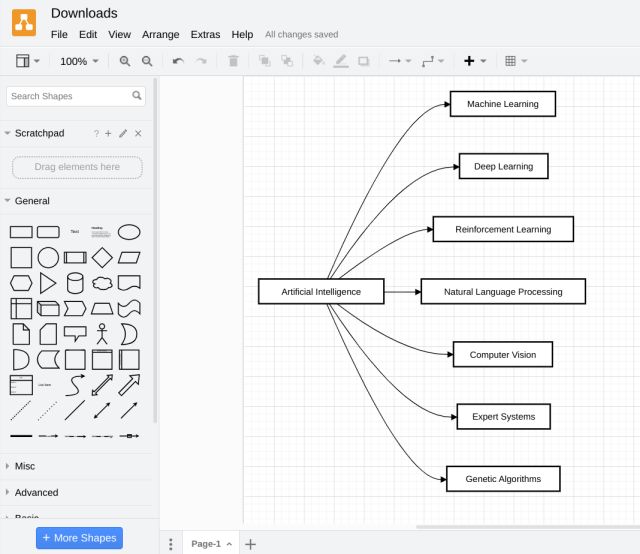
5. And there you have it. The diagram will be ready, and you can also export it in image formats, including PDF. You can create even more complex diagrams in ChatGPT using the Mermaid syntax.
6. I also asked a reasoning question and queried ChatGPT to output the code in Mermaid to understand the relation visually. It correctly identified the answer.


